October 4, 2016
Yield-Seekers Beware
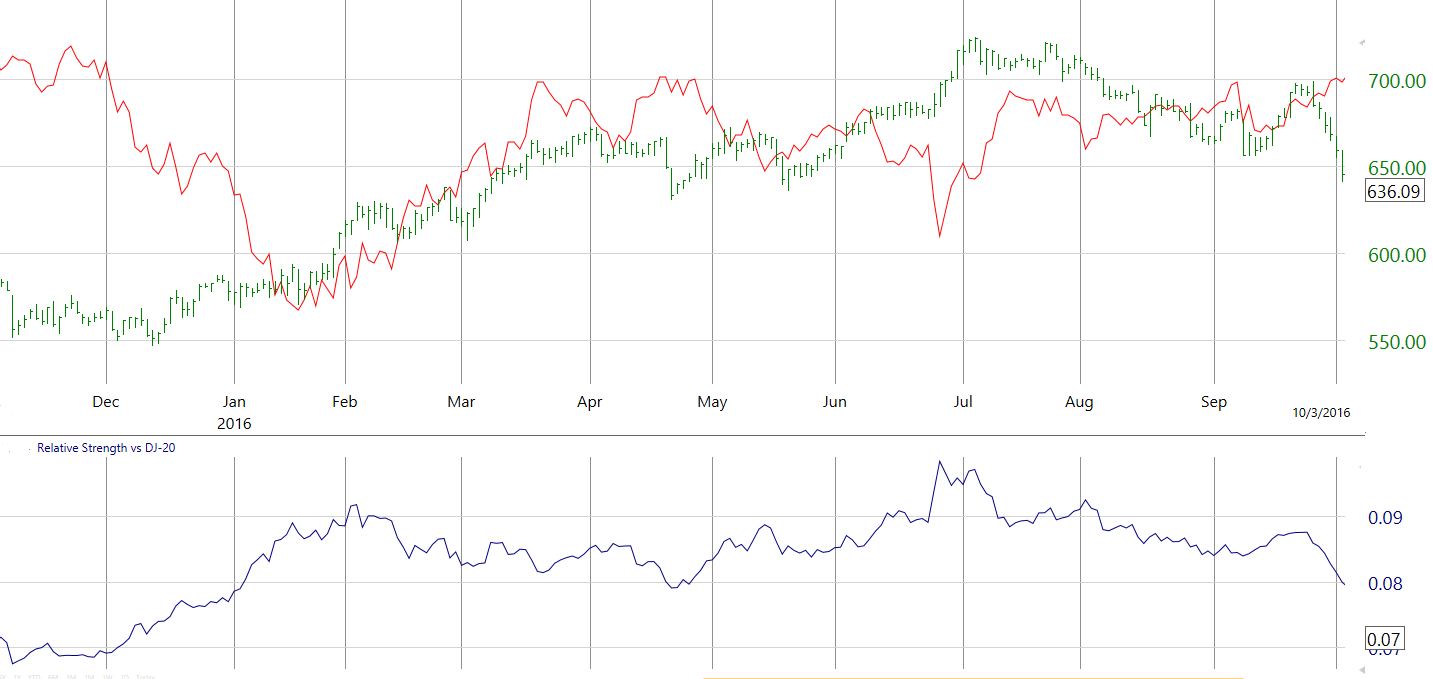
Low and even negative interest rates form the canvas against which investment decisions are being made. It is not a new frame work; we’ve even highlighted in recent issues that the trend is so old as to be raising the odds of its having finally run its course. We stated last issue that “we’d clearly suggest being wary of the yield-seek trade”. The antithesis of buying a stock for its yield characteristic is to be buying one for its growth capability. And no index other than the Dow Transportation Index has greater ‘growth’ metrics. We note in the following chart the divergent action in the Dow Utility Index (the yield index) and the Dow Transportation Index (the growth index). We’re going to date the changing landscape to June 27, the apex in the Utility Index’s peak relative strength mark. As can be seen in the following chart, the utilities average peaked in early July, and it has since been in correction mode. As we are writing this, it is the only Index to have breached its early September low. At the same time, the Transportation Index broke out to its highest level since last December.
Top Pane: Dow Utility (Blue) vs Dow Transports (Yellow)
Lower Pane: Relative Strength Dow Utility vs Dow Transports
Chart(s) courtesy of TC2000.com

What keeps us up at night is wrestling with the question of whether stocks can generally move higher in the face of an unwinding yield-seeking trade and with so many professionals crowding into the likes of Amazon. It is also a bit discomforting that the Utilities are breaking down without interest rates going higher. We’d postulated “hope” that a returning growth metric might lead to higher interest rates as compared to rates rising because the Federal Reserve arbitrarily decided they ‘needed’ to raise rates. It is also a bit concerning that the two Federal Reserve GDP models (
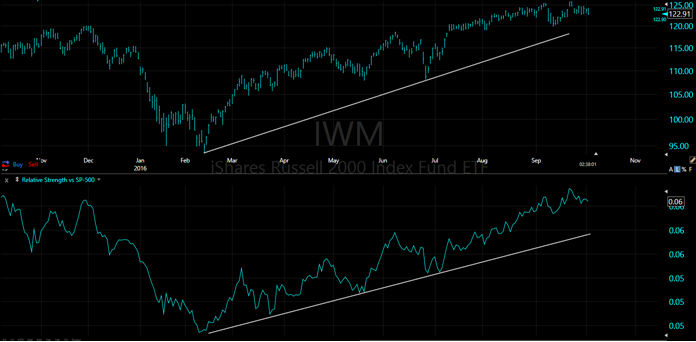
That having been said, we take a lot of comfort in the high level of negativity. As we pointed out last issue, there is no shortage of commentators calling for a violent end of this now aged bull market. We wrote last issue, “that while many things are different in this ‘new world,’ human nature is never changing. And the Clarion call for the exits evidences a collective fear suggesting to any good contrarian that there must be another way.” But just how would a stronger stock market, if indeed that is the end result, manifest itself? We continue to suggest keeping an eye on the yield complexes via HYG, JNK, VWOB and LQD; they’ve held up well in recent weeks. We also need to see continuing relative strength in the transportation sector. And we’d like to see firm U.S. bond yields; the five-year treasury holding above 1.1% and the ten-year yield holding above 2.2%. The transportation sector would continue to be a beneficiary, and now the small cap stock sector begins to take on more importance. It will be important for the small-cap sector (the IWM ETF is a good proxy) to show relative strength, as it has since February, and ultimately take out its highs of June 2015. The absolute and relative strength trends of small caps are evidenced in the following chart.
Top Pane: iShares Russell 2000 Index (IWM)
Lower Pane: Relative Strength of IWM vs S&P 500
Chart(s) courtesy TC2000

So the new information is that economic models have weakened in their forecast for GDP growth and the Federal Reserve popped the cork on the idea of it buying corporate stocks and bonds. Both of these are worrying trends. Our hope for higher rates based on stronger fundamental underpinnings is thus weakened a bit. But the sentiment is quite negative and the trail markings (good transports sector, decent small cap performance, quiet yield structures and, as mentioned last month, firming energy prices) remain supportive of higher stock prices generally, albeit with yield-stocks continuing to underperform.
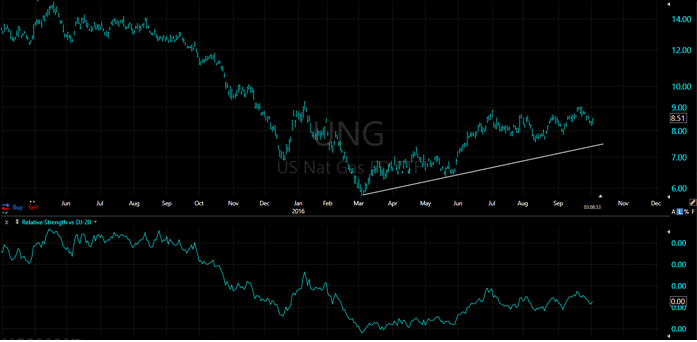
As with last month, we continue to “acknowledge the risks and confine new purchases to be made on weakness” and “you might look to scale back on any overweighting in high-yielding stocks.” We briefly mentioned natural gas last issue and are now formally suggesting its purchase. We are a buyer of one-half of a desired position of UNG at current prices (~$8.51).
U.S. Natural Gas ETF (UNG)
Chart(s) courtesy TC2000

Disclosure and Trading Policy
It should not be assumed that current recommendations will equal past performance or be profitable. The information presented has been obtained from sources believed to be reliable, but accuracy cannot be guaranteed. All material is subject to change without notice. Opinions offered are not personalized recommendations to buy, sell or hold securities. Officers, employees and affiliates of Roeing Research and Trading LLC may transact in Purchase and/or Sale Recommendations of the InternalTrends Blog or eNewsletter but not before the fourth day after the recommendation has been posted on the website; an exception being made for limit and/or stop orders that are not triggered at the time of dissemination. Securities mentioned in other parts of the eNewsletter or Blog may be bought or sold at any time.

Recent Comments